The built-in Desmos graphing calculator is one of the most powerful tools available on the SAT. Used strategically, this Desmos SAT calculator goes far beyond basic arithmetic; it is a sophisticated problem-solving tool that enables you to visualize equations, find regressions, and avoid careless calculation errors. By mastering Desmos for the SAT, you can improve both efficiency and accuracy across math topics, from pre-algebra through trigonometry.
For how the Math section is structured and other prep strategies, see our SAT math guide.
Getting comfortable with the Desmos interface
Explore the layout in Desmos or Bluebook so the SAT-specific layout feels familiar on test day.
Where to find and launch Desmos
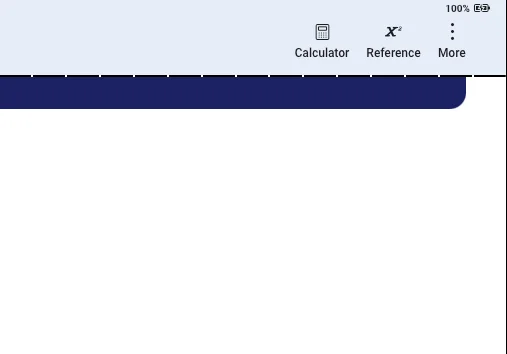
Because the SAT version of the Desmos graphing calculator differs from the standard version, practice with the SAT-specific tool. On test day, open Desmos by clicking the calculator icon in the toolbar of your digital testing interface (Bluebook app). From there, you can switch between the graphing and the scientific calculators. Since the graphing calculator can do everything the scientific calculator can, and more, it's best to stick with the graphing calculator.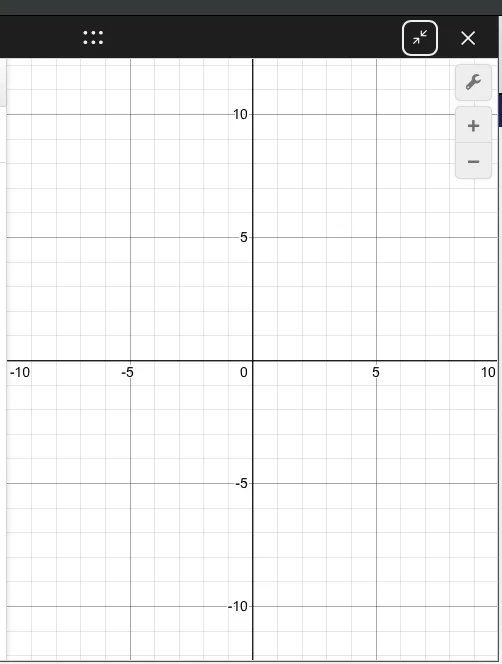
Graphing area
This is where graphs are displayed.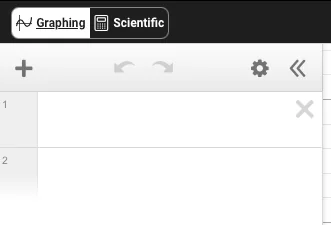
Expression list
This is where you enter equations, functions, points, and commands. Each line (or "expression") represents a separate input.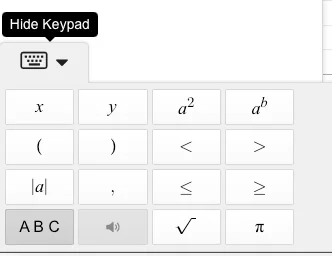
On-screen keyboard
Select the keyboard icon to access functions, symbols, and operators.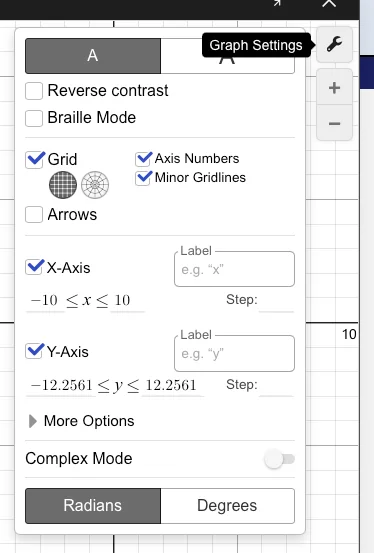
Settings
Select the wrench icon in the top-right corner of the graphing area to adjust settings such as axis scale, angle mode (radians or degrees), and complex number mode.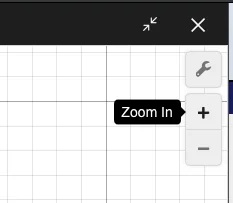
Zoom and navigation tools
Use the plus and minus buttons in the upper-right corner to zoom in and out. If you enter an equation and nothing appears, the graph is likely outside the default viewing window. Zoom out until it becomes visible. To return to the default view, select the home button below the zoom controls.
Note: In the SAT version of Desmos, the graphing area is the main screen, the expression list is on the left, and the keyboard icon is in the bottom-left corner. In the Bluebook app, the graphing area appears above the expression list, and the keyboard icon is at the top of the list.
Keyboard shortcuts:
- Exponent: Shift + 6 ( ^ )
- Fractions: Forward slash / or type frac
- Square root: Type sqrt
- Cube root: Type cbrt
- Nth root: Type nthroot
- Absolute value: Shift + \
- Pi (π): Type pi
- Inequalities: Type <= for ≤ and >= for ≥
Your turn: Start by entering a simple equation such as into the expression list. Next, enter two different equations (one per line) to see where they intersect. Then try entering a function. Continue exploring different expressions and practicing keyboard shortcuts until you feel comfortable navigating the interface.
💡Tip
Core SAT Desmos skills
1. Solve single-variable equations
You can use Desmos to solve most single-variable equations without relying on manual algebra. These methods work for linear, absolute value, radical, rational, quadratic, exponential, and logarithmic equations. There are two primary approaches:
The intersection method
Graph each side of the equation separately:
- Enter on one line — substitute the expression to the left of the equals sign for (left side).
- Enter on the next line — substitute the expression to the right of the equals sign for (right side).
The x-coordinate of the point where the graphs intersect is the solution (click the point to view its coordinates). If the graphs do not intersect, there is no real solution. If the two graphs are identical (they overlap completely), there are infinitely many solutions.
The vertical line method
Enter the equation exactly as written (e.g., ). Desmos will display a vertical line, and the x-value of that line is the solution.
- If no line appears → the solution may be out of view (zoom out) or the equation may have no solution or infinitely many solutions. To determine which, use the intersection method.
Note: If the equation uses a variable other than x (e.g., ), rewrite it using x before entering it into Desmos (). Otherwise, Desmos will treat the variable as a parameter and prompt you to create a slider instead of solving the equation.
2. Read key features and visualize functions
Desmos can quickly reveal key features of graphs and help you visualize equivalent expressions, systems of equations, and coordinate geometry so you can skip tedious calculations and hand-drawn sketches.
Finding key graph features
Enter an expression, equation, or function. Click on the graph, and Desmos will highlight points of interest with gray dots. Hover over or click any dot to see its exact coordinates. Use this to identify:
- x-intercepts: where the graph crosses the x-axis
- y-intercepts: where the graph crosses the y-axis
- vertices: the maximum or minimum point of a parabola or other curve
Tip: Use this approach when a question asks for a maximum or minimum (vertex) or for roots, zeros, or solutions (x-intercepts).
Identifying equivalent expressions
When a question asks which of the following expressions is equivalent to …, enter the given expression on line 1. Then enter the answer choices on the lines below it. The choice whose graph perfectly overlaps the original expression is the answer.
Tip: If you are uncertain whether the graphs perfectly overlap or almost match, click the colored circle next to the typed equation. This turns the line off and on, making it easier to spot a perfect match.
Solving systems of equations
When asked to solve a system of equations, enter the first equation on line 1 and the second equation on line 2. Click on the point(s) of intersection to find their coordinates. The (x, y) coordinates of the intersection are the solution to the system. If the graphs do not intersect, there is no real solution. If the two graphs are identical, there are infinitely many solutions.
Note: This works for systems of inequalities, too. Look for the area where the shaded regions overlap.
Visualizing coordinate geometry
When a problem describes a situation on the coordinate plane without a diagram, translate the description into equations and let Desmos graph it.
Geometry formulas
- Distance between two points: type
distance((x1, y1), (x2, y2)) - Midpoint: type
midpoint((x1, y1), (x2, y2))
Tip: Use this method for problems involving distance, circles, midpoints, or multiple constraints (including inequalities). Let Desmos handle the visualization to avoid errors from hand-drawn sketches.
3. Work with numbers efficiently
Fraction/decimal toggle: When a value is shown as a decimal or fraction (either entered or calculated), click the circle button with a fraction symbol inside to toggle between decimal and fraction display.
Tip: Use this when the answer choices are in a different form than your result.
Percentages: If you enter any number with a % sign (e.g., 30%), Desmos will generate the text “of” and wait for an input. Type a number or variable to find 30% of that value.
Storing values as variables: Assign values to variables by typing: [letter] = [number] (e.g., ). Desmos stores the exact value (no rounding), which you can reuse in later expressions. This reduces errors and saves time.
Example application
Given and , what is the value of ?
- Enter a = 19
- Enter b = -37
- On a new line, enter
- Desmos returns 5.125.
- Select the fraction icon to get 41/8.
4. Use sliders to explore unknowns
Sliders allow you to dynamically change the value of an unknown constant and see how it affects your graph in real time.
How to use sliders
- Enter an expression or equation using letters other than x and y to represent the unknown constants (e.g., or ).
- Desmos will prompt you to “add slider” for those unknown letters. Click the button for the variable(s) or select “all.”
- You can drag the slider left and right manually, or click the play icon to animate it.
- To change the range of the slider, click the numbers at either end of the slider bar and type in new minimum and maximum values.
Tip: If an SAT question gives you an equation with an unknown constant and a set condition, use a slider. Drag the slider until the graph visually meets the requirement of the question—such as passing through a specific coordinate point, shifting to have exactly two x-intercepts, or reaching a specific maximum or minimum value. Look at the number on the slider when the condition is met, and that is your answer.
5. Recognize patterns with tables and regressions
When given a set of data points and asked to identify an equation or trend, use the regression feature. A regression finds the line or curve that best fits your data.
Setting up a table
- Type “table” or use the + icon in the top left to create a data table.
- Enter x values under and y values under .
Running a linear regression
- The button method: Once you've entered a table, click the Add Regression button to the left of the table and select your model.
- The typing method: On a new line, type . Desmos will calculate the slope (m) and y-intercept (b).
Note: Remember to use the tilde (~) instead of an equals sign, and include the 1 after x and y to link the equation to your specific table. If you have only one point and a slope, you must type the regression formula manually; the regression button requires at least two points.
Other regression types
If the data isn't a straight line, you can select other regression models or type:
- Quadratic:
- Exponential:
- Logarithmic:
- Radical:
6. Calculate measures of central tendency
Desmos is a fully functional statistics calculator. You can type any of the following commands directly into an expression line:
- Mean: Type mean(1, 2, 3, 4)
- Median: Type median(1, 2, 3, 4)
- Standard deviation: Type stdevp(1, 2, 3, 4) for population standard deviation or stdev(1, 2, 3, 4) for sample standard deviation.
Tip: Define a list as a single variable using brackets (e.g., ). You can then run mean(L) or median(L) without retyping numbers.
7. Master functions
Take advantage of Desmos's advanced function notation and graphing tools to solve high-level algebra and pre-calculus questions.
Evaluating functions: Define a function like . On the next line, type to evaluate it at x = 3. You can even combine them (e.g., ).
Finding unknown inputs: When a question asks for what value of x does , enter the original function. Then, on a separate line, type . Click the point of intersection of the original function and the horizontal line.
Domain restrictions: You can restrict a graph to a specific interval by adding curly brackets at the end. For example, typing will only graph the right side of the parabola.
8. Use number theory shortcuts
Bypass tedious hand-calculations for factors, multiples, and remainders using these built-in functions:
- LCM (least common multiple): Type lcm(10, 20). This also works with more than two numbers.
- GCF (greatest common factor): Type gcf(10, 20). This also works with more than two numbers.
- Modulo (remainders): Type mod(dividend, divisor). Use this for questions like “What is the remainder when 155 is divided by 7?” by typing mod(155, 7).
Desmos strategies by SAT math domain and skill
| SAT Math domain | SAT Math skill | Desmos strategy |
|---|---|---|
| Algebra | Inequalities | Graph inequalities to view shaded solution regions. For systems, the solution set is where the shaded regions overlap. |
| Algebra/Advanced Math | Evaluating functions | Define the function as , then type to find the output when . |
| Algebra/Advanced Math | Function translations | Graph , then graph to visualize horizontal and vertical shifts. |
| Advanced Math | Equivalent expressions | Graph both expressions as y= equations. If the graphs overlap exactly, the expressions are equivalent. |
| Advanced Math | Quadratics | Graph the quadratic, then click the highlighted points to identify the vertex or intercepts. |
| Advanced Math | Domain restrictions | Add braces such as {x > 0} after an equation to restrict the graph to a specific interval. |
| Problem-solving and data analysis | Data summaries | Use keywords like mean(list) and median(list) to calculate statistics quickly. |
| Problem-solving and data analysis | Percentage calculations | Compute percentages by typing decimals (e.g., for 15% of 80). |
| Geometry and trigonometry | Circle equations | Graph the circle equation to visualize the center and radius. |
| Geometry and trigonometry | Distance formula | Define points such as A = (x₁, y₁) and B = (x₂, y₂), then type distance(A, B) to find the distance between them. |
Time strategy: when (and when not) to use Desmos
Knowing how to use Desmos, your SAT math calculator, is only half the battle. The other half is knowing when it is the most efficient tool. Desmos saves the most time on systems of equations, single-variable equations, function evaluation, quadratics, regressions, and statistical calculations. For single-step arithmetic or simple algebra, working mentally or quick work on paper is often faster. To build good instincts, try solving the same practice problem with and without Desmos to see which approach is faster for you.
Common pitfalls and limitations
Even though Desmos is a powerful tool, it comes with potential pitfalls. One of the most common—and costly—mistakes is forgetting to check whether you are in degree or radian mode. It's also easy to misinterpret graphs, especially when distinguishing between true intersections and points where graphs only touch.
Rounding errors can occur if you rely on decimals instead of storing exact values in variables. In addition, some functions available in the standard desktop version of Desmos may be limited or unavailable in the SAT testing version. Finally, excessive zooming can cause you to lose important context, making it harder to interpret the graph accurately.
Tips for test day
- Always check radians vs. degrees: Before any trigonometry problem, open the Settings (wrench icon) and confirm that the angle mode matches the question. This is one of the most common and costly Desmos mistakes on the SAT.
- Zoom out when nothing appears: If you enter an equation and nothing appears, the graph is likely outside the default viewing window. Use the minus button to zoom out or adjust the axis range in settings.
- Use the fraction feature: Desmos often displays answers as decimals. If answer choices are in fraction form, convert to a fraction to avoid mismatches.
- Change non-standard variables to x: The SAT uses many variable names (p, t, n, k). When solving for one of these in Desmos, substitute x so it is treated as the graphing variable rather than creating a slider.
- Use intersections strategically: For many solve-for-x questions, graphing both sides of the equation and identifying the intersection is often faster than algebraic manipulation and helps reduce arithmetic errors.
- Use Desmos as a checker: Even if you solve a problem by hand, you can quickly graph the expression to verify your answer before moving on.
Ready to practice?
Put these strategies into action with Acely. Practice using Desmos in real time on full SAT tests or targeted questions, with step-by-step guidance from Acely's AI tutor on how to solve each problem.
Try Acely's digital SAT math practice now