
The ACT Desmos calculator (the built-in graphing calculator for the math section of the digital ACT) is a powerful resource on test day. It is far more than a tool for basic arithmetic; it is a sophisticated problem-solving engine that allows you to visualize equations, find instant solutions, and avoid careless algebraic errors. By mastering ACT Desmos features, you can significantly increase your efficiency and accuracy across all math domains, from pre-algebra through trigonometry and pre-calculus.
For how the digital test works end to end, see our digital ACT guide. For section-level prep, start with our ultimate ACT 2026 guide. For the ACT Math section (timing, topics, and strategies), see our ACT Math guide. If you test with approved accommodations, see our ACT accommodations guide.
Digital ACT only
ACT Desmos calculator: the testing build
The Desmos calculator available on the digital ACT is a specific, secure testing build of Desmos. ACT and Desmos turn off features that don't belong in the ACT exam, such as folders, notes, and images. When you're studying for the ACT with Desmos, make sure to verify that you're using the correct calculator.
- What to expect: Core graphing, tables, regression, and keypad entry work the way this guide describes. Practice inside the ACT-style tool so muscle memory matches test day.
- Angle mode: Confirm radians vs. degrees in Graph Settings before every trig question. Wrong mode is a common score-killer.
Please read Desmos's official ACT Desmos Calculator reference (PDF) for specifics on the controls for the ACT Desmos version.
Familiarizing yourself with the Desmos interface
Before diving into specific features, get comfortable with the basic layout. You can also explore Desmos online for extra practice. The on-screen layout matches what you'll use on the digital ACT:
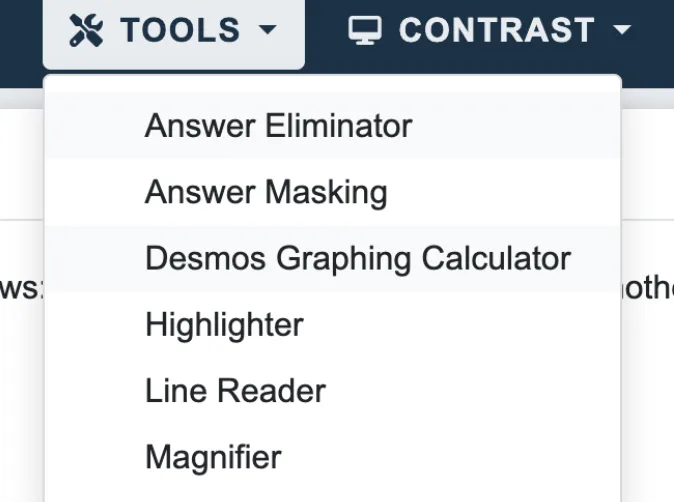
Accessing the tool
Click Tools in the top testing bar, then select Desmos Graphing Calculator. The menu also lists other tools such as Answer Eliminator, Answer Masking, and Highlighter.
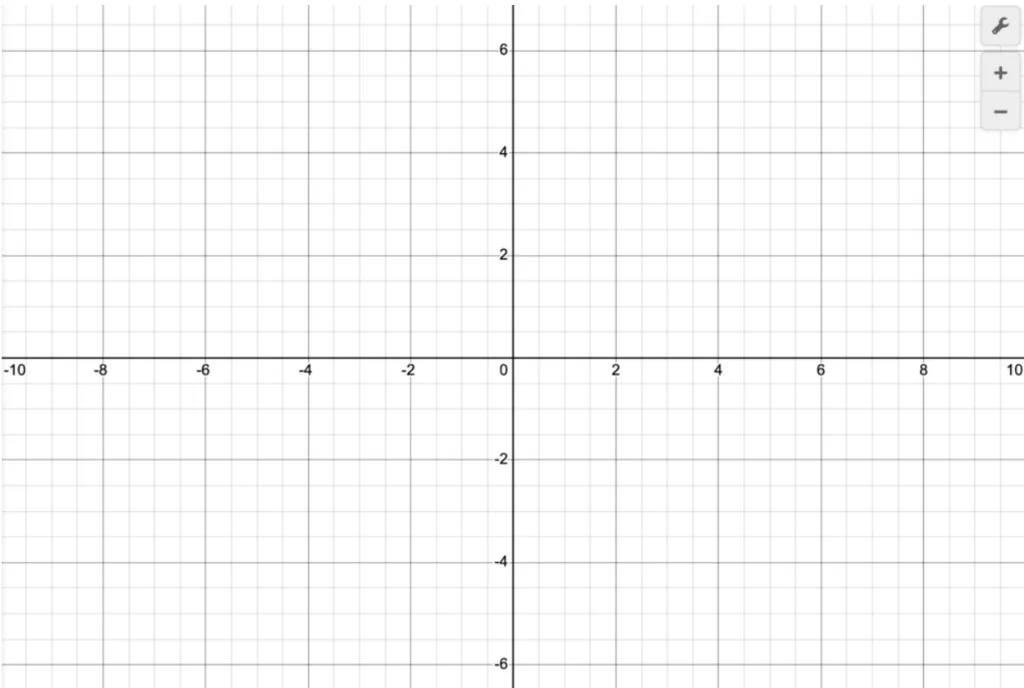
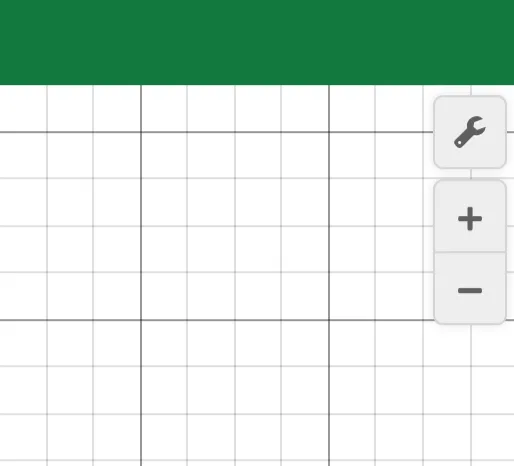
Graphing area (main screen)
This is where all your graphs, points, and visuals appear: it’s your canvas. The default view shows the coordinate plane and grid until you pan or zoom.
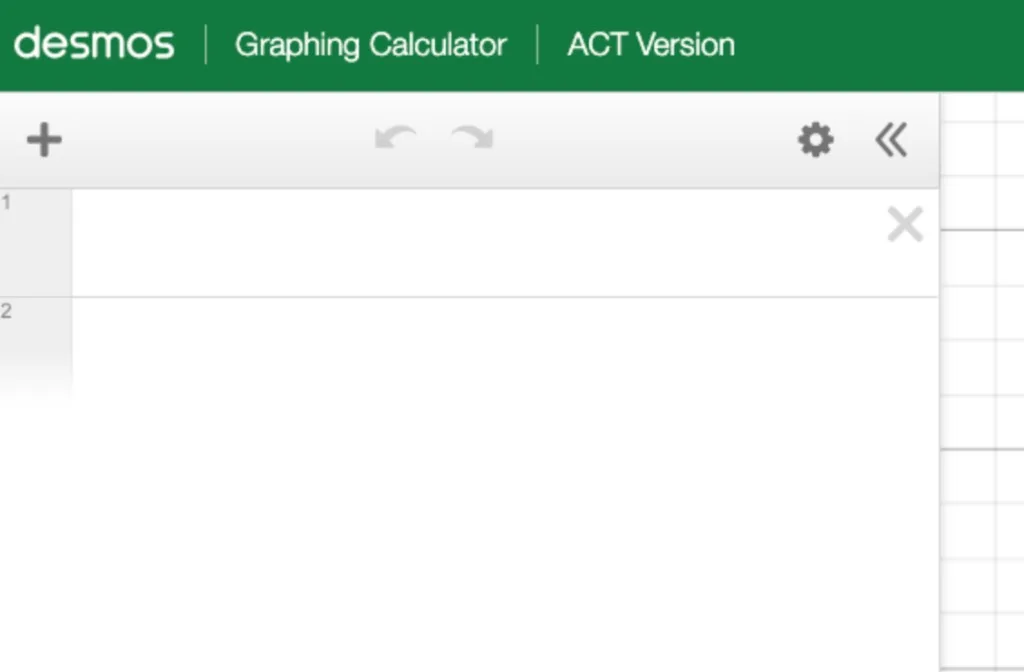
Expression list and ACT version
The header shows you’re using the ACT Version of the Desmos graphing calculator. The toolbar lets you add expressions, undo or redo, and open settings. Numbered rows on the left are where you type equations, functions, and commands; each line is a separate expression.
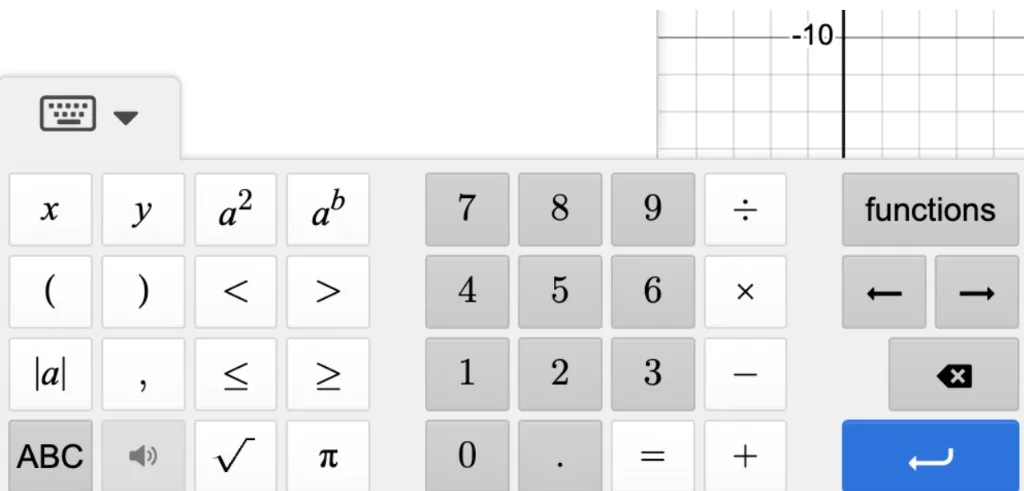
On-screen keyboard
Open the keypad to enter numbers, operators, inequalities, roots, absolute value, pi, and more. Use the functions button for advanced math; the blue Enter key confirms input.
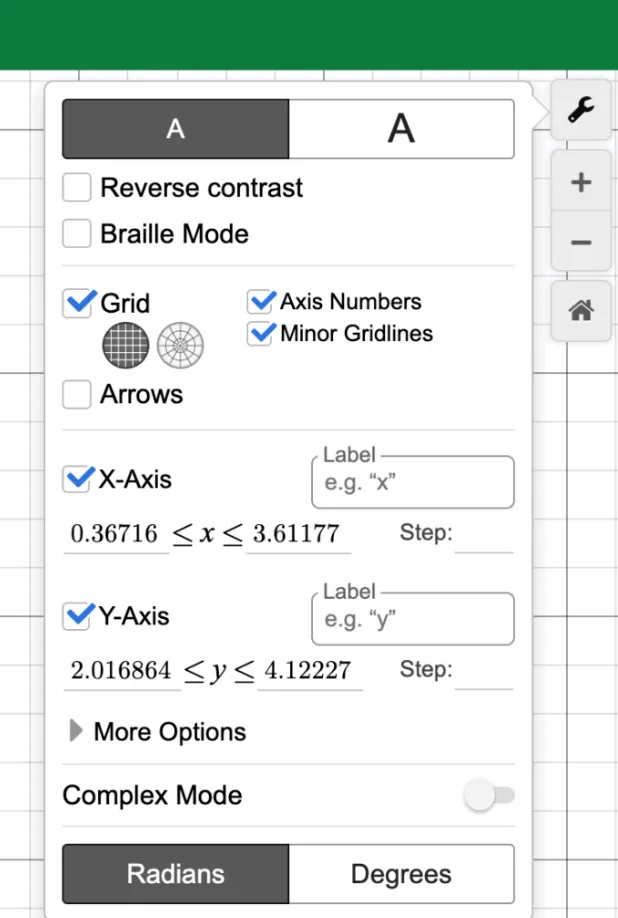
Settings (wrench icon)
Open Graph Settings to adjust the grid, axes, font size, and contrast. Toggle Complex Mode for imaginary numbers, and switch between Radians and Degrees for trigonometry. Always match the mode to the question.
Zoom controls
Use the plus and minus buttons on the right to zoom in and out. If you enter an equation and nothing appears on screen, zoom out until the graph is visible.
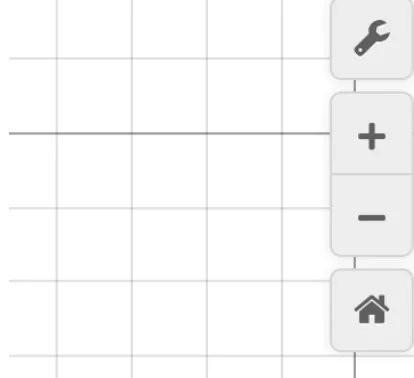
Home (default view)
When you’re zoomed in or panned off center, use the home button to snap back to the default view centered on the origin.
Spend a few minutes during study sessions typing simple equations like before test day.
Core ACT Desmos features
1. Solving equations for x
Desmos can solve equations without manual algebra. Three approaches:
- Method 1 (graph both sides): Graph the left side and right side as two lines, e.g. and . The x-coordinate of the intersection is the solution. No intersection can mean no solution; identical overlapping lines can mean infinitely many solutions.
- Method 2 (type as written): Enter the equation as it appears and look for the vertical line; its x-intercept is the answer. A blank screen may mean no or infinite solutions. Works for linear, absolute value, radical, rational, quadratic, exponential, and logarithmic equations.
Use x in Desmos
2. Visualizing equations and intercepts
- How: Type any equation in an expression line; graph multiple functions in different colors.
- Why: Grey dots mark x-intercepts, y-intercepts, and vertices; click for exact values, often the answer.
3. Fractions, decimals, and percentages
- Fraction/decimal toggle: After a number, use the circle fraction button to switch display; highlighted white often returns a fraction.
- Percentages: Type a value with % (e.g. 30%). Desmos prompts “30% of ____” so you can fill in any number or variable.
4. Defining variables and storing values
Assign a calculation to a letter: type something like on its own line (use brackets for expressions). Desmos stores the exact value without rounding so you can reuse it on later lines, ideal when a problem gives you values for a and b and asks for a compound expression.
5. Sliders for unknown constants
- How: Enter the expression and choose Add slider, or adjust the value by clicking or dragging.
- Why: Drag until the graph meets the condition the question requires (through a point, max/min, etc.).
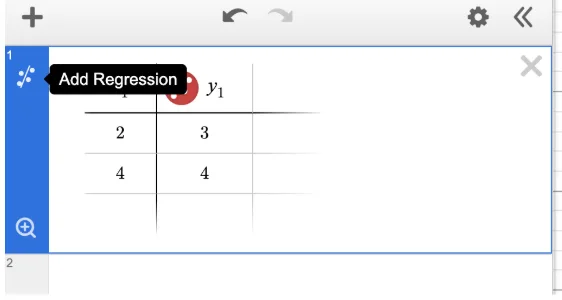
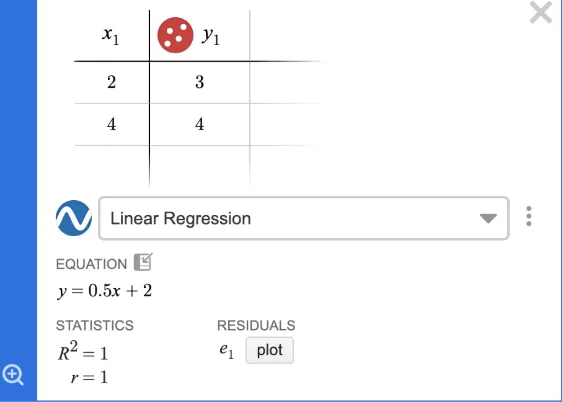
6. Data tables and regressions
- Table: Type “table” or use the + icon. Enter values under x₁ and y₁.
Linear regression
Click Add regression on the table (see the first screenshot) or type . Use ~, not =. Desmos then shows the line of best fit, equation, and statistics (second screenshot). For one point plus slope, type the regression manually; the Add regression control needs at least two points in the table.
- Other regressions: Choose quadratic, exponential, logarithmic, or radical forms from the dropdown when needed.
7. Statistics and data functions
- mean(1, 2, 3, …) or mean([list])
- median(1, 2, 3, …) or median([list])
- stdevp(1, 2, 3, …)
- Weighted mean / frequency tables: Table with values in x₁ and frequencies in y₁, then use
total(x₁ * y₁) / total(y₁)for expected-value style problems. - List shortcut: Define and use mean(L), median(L), etc.
8. Number theory shortcuts
- lcm(10, 20) (works with more than two numbers)
- gcf(10, 20) (works with more than two numbers)
- Remainder: mod(dividend, divisor) for “what is the remainder when … ?” questions.
9. Complex number operations
Open the settings wrench and enable Complex Mode. Then enter expressions like directly.
10. Keyboard shortcuts
- Exponent: Shift + 6
- Square root: type sqrt
- Cube root: type cbrt
- Absolute value: type abs or use |a| on the keypad
- Pi: type pi
- Fractions: type frac for a template
- Inequalities: type <= and >= for ≤ and ≥
Strategic hacks for ACT math domains
| ACT math domain | Strategic Desmos move |
|---|---|
| Pre-Algebra | Fractions and percentages: Toggle between decimal and fraction display with the fraction button. Use the % sign directly in calculations and equations. |
| Pre-Algebra | LCM, GCF, and remainders: Use lcm(), gcf(), and mod() to skip manual number theory work entirely. |
| Algebra | Solving any single-variable equation: Type the equation as written or split it into two sides and find the intersection. Works for linear, absolute value, rational, radical, and more. |
| Algebra | Systems of equations: Graph each equation on a separate line and click the intersection for the exact (x, y) solution. Two parallel lines = no solution; overlapping lines = infinite solutions. |
| Algebra | Inequalities: Graph the inequality. Desmos shades the solution region. Solid lines indicate ≤ or ≥; dashed lines indicate strict < or >. |
| Algebra | Solving a formula for a specific letter: Type the formula as a regression statement, then plug in answer choices to see which matches. Use sliders if two choices return the same value. |
| Functions | Evaluating functions: Define f(x) = expression, then type f(3) to evaluate at x = 3 instantly. For combinations, type f(2) - g(1) directly. |
| Functions | Find y for a given x: Graph x = # as a vertical line and find the intersection with your function. |
| Functions | Find x for a given y: Graph y = # as a horizontal line and find the intersection with your function. |
| Functions | Function translations: Graph f(x), then define g(x) = f(x - h) + k to see how horizontal and vertical shifts move the curve. |
| Functions | Identifying function type from data: Enter points in a table and try different regression forms (linear, quadratic, exponential) to see which model fits best. |
| Advanced Algebra | Quadratics: Graph any quadratic and click the grey dots for the vertex (max or min) and x-intercepts (solutions) without manual algebra. |
| Advanced Algebra | Polynomial roots and factoring: Graph the polynomial and read x-intercepts. For each intercept c, the polynomial has a factor (x - c). |
| Advanced Algebra | Equivalent expressions: Graph two expressions. If the lines overlap exactly, they are equivalent. For expressions without x or y, type both and compare numerical values. |
| Advanced Algebra | Max/min of an expression: Plug in each answer choice to find which gives the max or min, or add sliders for each letter and drag to find extremes. |
| Advanced Algebra | Finding unknown constants via regression: Replace x with x₁ and = with ~, then create a list x₁ = [1, 2]. Desmos returns the constants automatically. |
| Sequences | Arithmetic sequences: Enter term numbers in x₁ and values in y₁, then use y₁ ~ mx₁ + b. The slope m is the common difference d. |
| Coordinate Geometry | Midpoint: Type midpoint((x₁, y₁), (x₂, y₂)) and click Label to show exact coordinates, useful for the center of a circle from diameter endpoints. |
| Coordinate Geometry | Distance: Type distance((x₁, y₁), (x₂, y₂)) for the exact length between two points. |
| Coordinate Geometry | Circle equations: Type (x - h)² + (y - k)² = r² to visualize center and radius instantly. |
| Counting | Permutations and combinations: Type nPr(9, 5) or nCr(9, 5) directly in the expression list. |
| Statistics | Weighted mean / expected value: Create a table with values in x₁ and frequencies or probabilities in y₁, then type total(x₁ * y₁) / total(y₁). |
| Trigonometry | Graphing trig functions: Graph y = sin(x), y = cos(x), or y = tan(x) to read amplitude, period, and phase shifts. Verify Radians/Degrees first. |
| Trigonometry | Solving trig equations: Graph both sides (e.g., y = sin(x) and y = 0.5) and find intersection points for all solutions. |
| Pre-Calculus | Logarithms and exponentials: Graph to find intercepts, asymptotes, and key values, or use regression to find the equation from points. |
| Pre-Calculus | Domain restrictions: Add curly brackets like {x > 0} after an equation to restrict the graph to an interval. |
| Pre-Calculus | Sum notation: Type sum to access Σ. Fill in start, end, and formula in terms of n to compute a series. |
Practical tips for test day
- Always check radians vs. degrees in the settings wrench before trig. Wrong mode is one of the most costly mistakes.
- Zoom out when nothing appears. The graph may be off-screen. Use minus or set a new axis range.
- Use the fraction button when answer choices are fractions. Desmos often shows decimals by default.
- Change non-standard variables to x when solving so Desmos graphs instead of creating sliders.
- Trust intersections for “solve for x”: graphing both sides and clicking the intersection is usually faster than long algebra.
- Use Desmos as a checker even when you work by hand. A quick graph verifies your work before you move on.
Knowing when to use Desmos
Knowing how to use Desmos is half the battle; the other half is knowing when it is the most efficient choice. Desmos saves the most time on systems of equations, single-variable solving, function evaluation, quadratics, regressions, and statistics. For single-step arithmetic or very simple algebra, mental math is often faster. Desmos should complement your conceptual understanding without replacing it, so you pick up quick points, avoid careless errors, and lean on it where manual work is slow or error-prone.
Ready to practice?
With Acely, you can practice using Desmos on a full ACT practice test or individual questions. Ask Acely's AI tutor to walk you through the Desmos approach for any question you miss. Pair this guide with our ACT Math guide for section-wide prep, and explore problem-specific walkthroughs in our Desmos guide library.
Frequently asked questions
Desmos is built into the digital ACT Math section. If you test on paper, you bring your own approved calculator instead—see the official ACT calculator policy.
For graphing and solving, substitute x in Desmos when the question uses another variable. Using non-standard letters can make Desmos create a slider instead of solving the equation. Always rewrite the equation in terms of x (or use x as the variable you are solving for) so Desmos treats it as a graphing variable.
Open the settings wrench in Desmos and confirm the angle mode matches the question before you graph or evaluate trig. Wrong mode is one of the most common costly mistakes on test day.
Use Acely for full-length ACT practice with the same calculator-in-test experience, or explore step-by-step examples in our Desmos guide library. For big-picture context, read our digital ACT guide and this cheat sheet.